2. Topology#
Nodes and traces define the topology of the network. Topology is a useful branch of mathematics used to study properties that do not change with continuous transformations of space or scale. Nodes can be classified by counting the number of connections to traces. Isolated I nodes are connected to one trace only. Y/T and X nodes are respectively connected to 3 and 4 traces. Finally, “unknown” U nodes are located at the intersection between a fracture and the sampling area boundary (i.e boundary nodes). Nodes also have important geological significance. I nodes indicate fracture isolation, and thus a network with a prevalence of these nodes, will be less connected and fluid flow will be more restrained. Y and X nodes correlate respectively to abutting and crosscutting relationships. Both types contribute heavily on fluid transmission in the rock volume, in particular Y nodes, because they lower the total number of I nodes in the fracture network. U nodes indicate that the fracture is censored because it is not completely exposed in the sampling area and thus some measured properties are incomplete (such as length). Any fracture network can be classified using the connectivity index value (equation A6 in Manzocchi (2002) and plotted in a ternary plot that with the I, Y, and X relative proportions at each vertex.
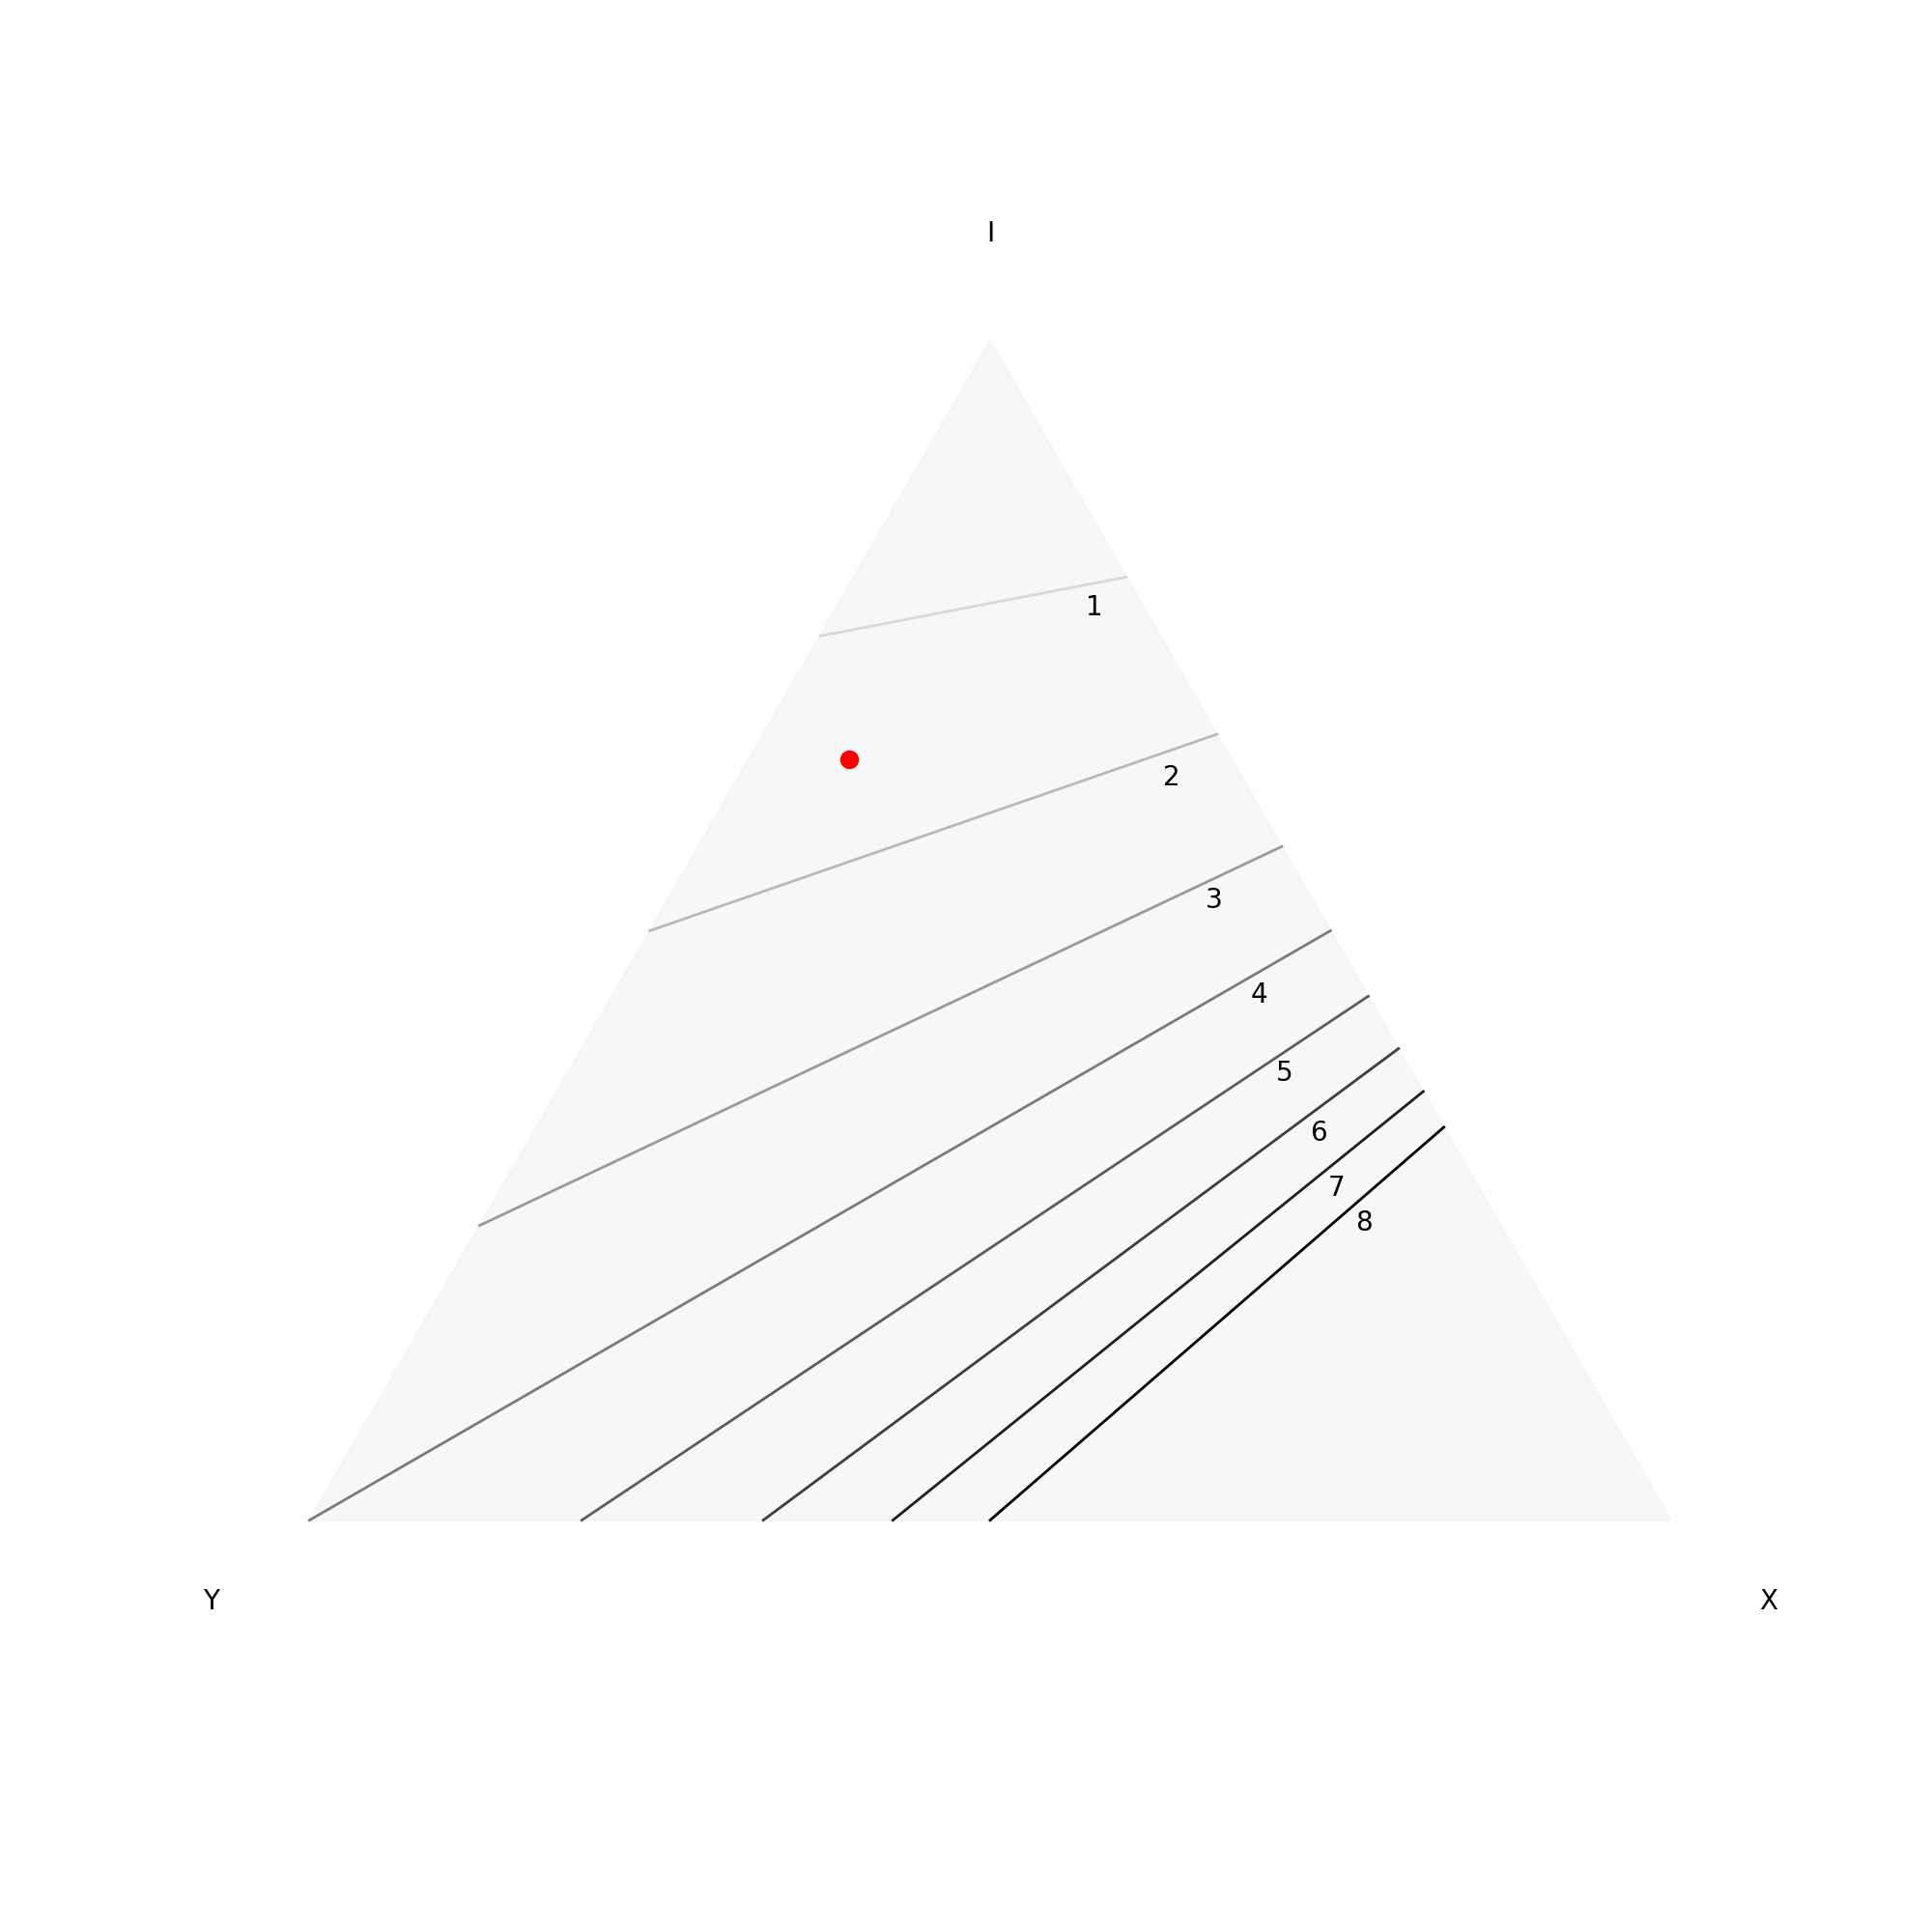
Ternary plot of a fracture network. The red dot corresponds to the I, Y and X nodes proportions of the outcrop. The contour lines are the average number of connections per fracture derived from equation A6 in Manzocchi (2002).#
With nodes it is possible to analise a fracture network in a more abstract way by defining connections and relations between fracture segments. In a fracture network, fractures are connected in different ways (and sometimes even isolated) and by focussing on the topological relationships between objects it is possible to extrapolate interesting descriptive features. A complex fracture network can be simplified by defining a Graph (G) composed of Edges (E) and Vertices (V) such that for each edge there are two vertices. This means that the degree at each node (i.e. how many edges are connected to a node) can be used to classify them accordingly.
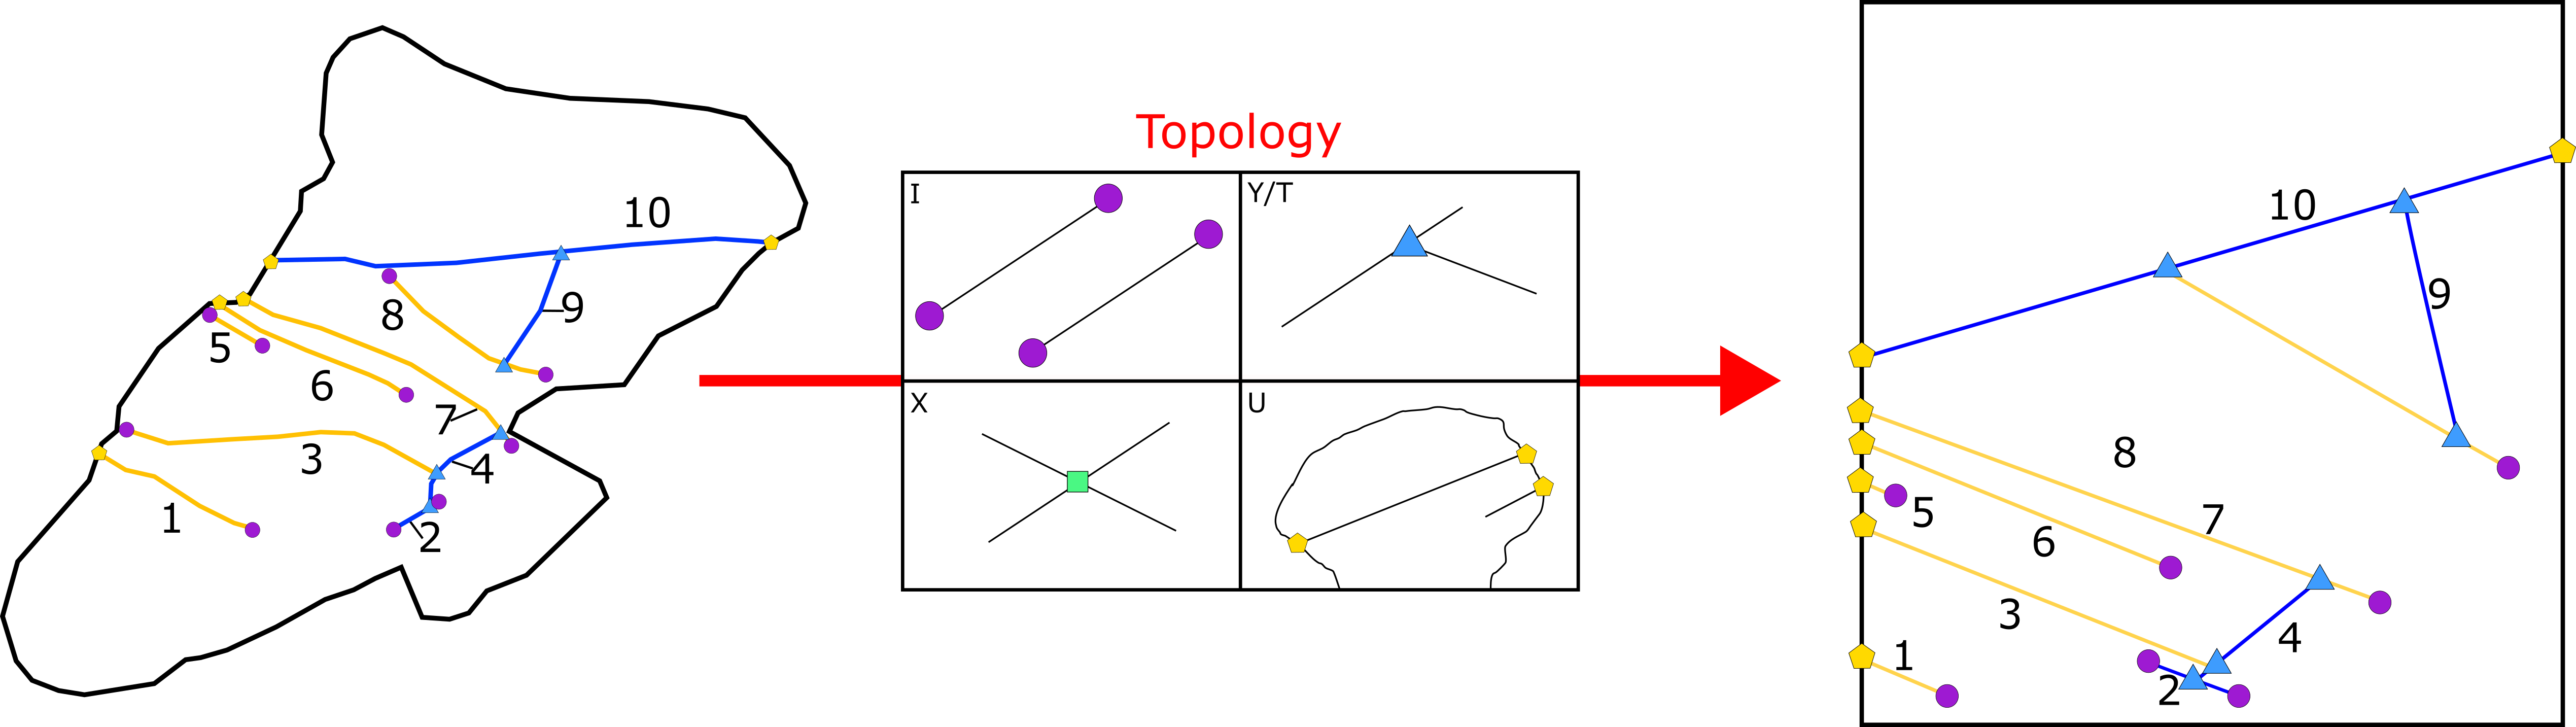
Abstraction example of a small fracture network. Spatial relationships are partially conserved to help in the comparison. Higher abstraction is possible in which the spatial dimension is completely disregarded.#